
Last Updated on September 11, 2026 by Daniel Globe
Airline accident rankings can look simple, but raw crash totals are easy to misread. Different databases count different aircraft, operators, event types, and time periods. A large airline may also record more events simply because it operates far more flights. To compare airline safety fairly, you need consistent definitions, exposure-based accident rates, recent oversight data, and official investigation records.
Quick Answer
No official global authority identifies one airline as having the most accidents under a single standardized method. Rankings change with the reporting period, accident definition, operating-carrier rules, and number of flights. For a fair comparison, use accidents per million flights, recent audit status, regulatory oversight, and official investigation findings.
Key Takeaways
- There is no authoritative worldwide league table naming one airline as the worst.
- Raw totals must be adjusted for the number of flights and years of operation.
- Airline brands, subsidiaries, and codeshare operators can be counted differently.
- IOSA registration and government oversight data are more useful than an unsupported online score.
- Fleet age provides context, but maintenance and continuing airworthiness matter more than a fixed age limit.
How Airline Safety Is Measured

Airline safety is measured with several indicators rather than one crash total. The most useful measures include accident rates per million flights, fatal-accident rates, the severity and type of each event, the airline’s recent operating history, audit status, and the quality of government oversight.
The IATA 2025 Annual Safety Report recorded 51 accidents among 38.7 million commercial flights. Eight were fatal accidents, and 394 people died onboard aircraft. That equals an all-accident rate of 1.32 per million flights.
The ICAO 2026 safety analysis reported 85 accidents and four fatal accidents during 2025 within its scheduled commercial-air-transport scope. ICAO and IATA totals differ because their coverage and classification criteria are not identical. This is why a safety statistic should always name its source and methodology.
A crash total without a date range, accident definition, operating scope, and number of flights is not a fair airline safety comparison.
| Safety measure | What it shows | Main limitation |
|---|---|---|
| Raw accident total | How many qualifying events appear in a database | Favors smaller or newer airlines unless exposure is considered |
| Accidents per million flights | Risk relative to operating exposure | Rare events can make annual rates fluctuate sharply |
| Fatality risk | The potential for loss of life across operations | One catastrophic event can dominate a year |
| IOSA registration | Whether an eligible operator meets an international operational-audit standard | It is not a guarantee that an accident can never occur |
| Government oversight | Whether national authorities can license, inspect, and supervise airlines effectively | It evaluates the wider oversight system, not only one flight |
Which Airlines Had the Most Accidents?
There is no single defensible answer because ICAO, IATA, national investigators, and private accident databases do not publish one standardized airline ranking. A comparison must first define the reporting period, aircraft size, type of operation, minimum damage level, security-event treatment, and whether subsidiaries or codeshare operators count under the marketing airline.
Air India, American Airlines, China Airlines, Korean Air, and Pakistan International Airlines often appear in online historical lists. However, their positions change when a database uses a different start year, includes nonfatal events, combines related operators, or counts all-time records instead of the last 20 years. Claims such as “11 accidents” or “28 accidents” are therefore not meaningful without the complete method behind them.
Brand attribution can also change a total. For example, the aircraft involved in the January 2025 Washington collision was operated by PSA Airlines but marketed as American Airlines Flight 5342. A database might list the event under PSA Airlines, American Eagle, American Airlines, or more than one label unless it applies strict operator rules.
Warning: Do not treat a raw historical crash count as an airline’s current safety score. It may reflect decades of operation, a large route network, acquired subsidiaries, or events that occurred before major safety reforms.
Major Fatal Airline Events Since 2000
The following are selected high-fatality events, not a ranking of the airlines involved. The table also separates conventional operational accidents from conflict-zone attacks and mixed civil-military events.
| Event | Year | Fatalities | Investigation finding or status |
|---|---|---|---|
| American Airlines Flight 587 | 2001 | 265 total, including 5 on the ground | The vertical stabilizer separated after excessive rudder inputs following wake turbulence. |
| China Airlines Flight 611 | 2002 | 225 | Investigators found that an in-flight structural breakup was highly likely linked to failure in the aft lower fuselage area. |
| Air France Flight 447 | 2009 | 228 | Temporary unreliable airspeed indications were followed by loss of control in flight. |
| Malaysia Airlines Flight MH370 | 2014 | 239 presumed lost | The aircraft remains missing, and investigators could not establish a definitive reason for its disappearance. |
| Malaysia Airlines Flight MH17 | 2014 | 298 | A Buk surface-to-air missile detonated near the cockpit. This was a conflict-zone security event rather than a conventional operational failure. |
| Air India Flight AI171 | 2025 | 260 total, including 19 on the ground | India’s AAIB said in June 2026 that the investigation remained in progress. No final cause should be assigned before the final report. |
| PSA Airlines Flight 5342 and U.S. Army helicopter collision | 2025 | 67 total | The NTSB identified systemic failures involving airspace design, safety oversight, and risk management. |
Note: Fatality totals measure the human impact of an event. They do not, by themselves, measure the present-day risk of flying with the airline involved.
Why Airline Accidents Happen
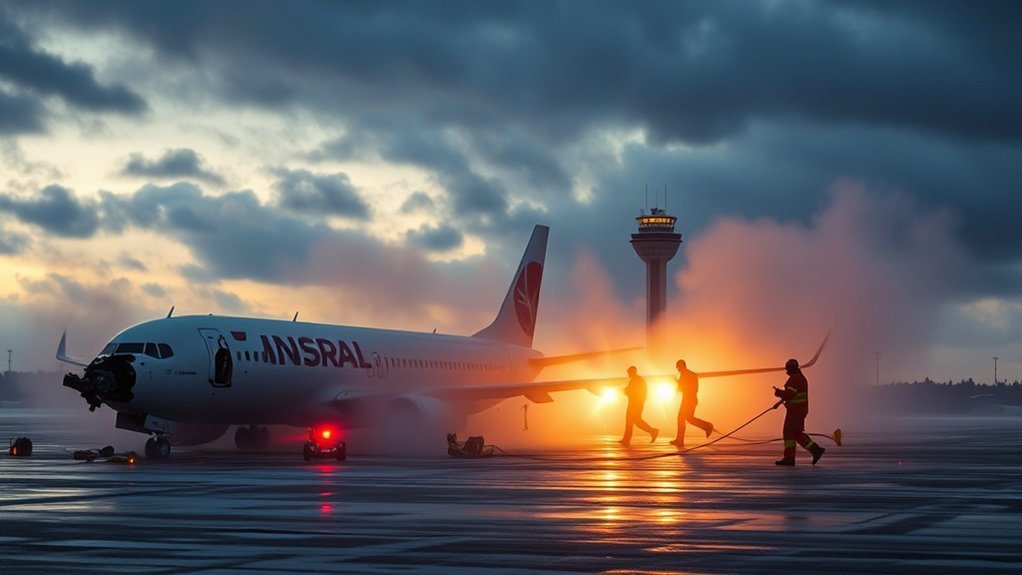
Airline accidents rarely result from one isolated mistake. Investigators examine the full chain of events, including aircraft systems, crew actions, procedures, training, maintenance, weather, airport infrastructure, air traffic control, organizational decisions, and regulatory oversight.
ICAO’s global high-risk occurrence categories include:
- Loss of control in flight: The crew can no longer maintain control of the aircraft.
- Controlled flight into terrain: An airworthy aircraft unintentionally strikes terrain, water, or an obstacle.
- Mid-air collision: Two aircraft collide while airborne.
- Runway excursion: An aircraft overruns or veers off a runway.
- Runway incursion: An aircraft, vehicle, or person is incorrectly present on an active runway.
Human Factors and Operations
Crew decisions, communication, fatigue, workload, automation management, and training can contribute to an event. However, describing an accident only as “pilot error” may hide underlying issues such as confusing procedures, poor equipment design, weak supervision, communication failures, or organizational pressure.
Maintenance and Aircraft Systems
Component failures, incorrect repairs, missed inspections, manufacturing defects, and incomplete maintenance records can contribute to accidents. Airlines and regulators manage these risks through approved maintenance programs, airworthiness directives, component-life limits, inspections, quality control, and safety reporting.
Weather, Airports, and Security
Thunderstorms, icing, wind shear, poor visibility, contaminated runways, inadequate lighting, and obstacles near a runway can raise operational risk. Conflict zones and unlawful interference require separate security assessments because they do not fit neatly within ordinary mechanical or operational accident categories.
How Airline Safety Improved Since 2000
Commercial aviation’s long-term safety trend has improved despite annual fluctuations. Boeing’s statistical summary reports that fatal accident rates fell by 65% when the most recent two decades were compared, even as flight departures increased. Improvements have come from training, aircraft design, investigation findings, maintenance standards, data sharing, and stronger safety-management systems.
Enhanced Pilot Training
Modern airline training includes crew resource management, recurrent simulator checks, upset-prevention and recovery training, threat-and-error management, and practice for rare emergencies. These programs help crews communicate clearly, recognize developing hazards, and respond consistently under pressure.
- Crew resource management improves teamwork and cockpit communication.
- Full-flight simulators recreate emergencies that cannot be practiced safely in an aircraft.
- Recurrent checks confirm that pilots maintain required skills.
- Flight-data analysis helps airlines identify unstable approaches and other recurring risks.
- Investigation recommendations guide updates to procedures and training.
Smarter Maintenance Systems
Airlines increasingly use aircraft health monitoring, sensor data, trend analysis, and predictive tools to identify unusual wear or system behavior. These systems can support earlier inspections and better maintenance planning, but they do not replace licensed engineers, approved maintenance programs, physical inspections, or regulatory oversight.
Older aircraft can continue operating safely when their structural-inspection programs, life-limited parts, repairs, airworthiness directives, and maintenance records meet applicable requirements. A newer aircraft can still be poorly managed, while an older aircraft can remain airworthy under a rigorous program.
Stricter Global Standards
ICAO standards, national oversight programs, safety-management systems, investigation recommendations, and operational audits have made airline safety more consistent. The IATA Operational Safety Audit evaluates an airline’s operational management and control systems.
In 2025, IOSA-registered airlines recorded 0.98 accidents per million flights, compared with 2.55 for non-IOSA carriers. IOSA registration is a useful indicator, but it should be considered with government oversight, recent operating history, and the airline’s complete safety system.
How to Compare Airline Safety Before You Book
You cannot predict the safety of an individual flight from a simple website score. You can, however, check several credible indicators before booking.
Check the Operating Carrier and Audit Status
First, identify the airline that will actually operate the aircraft. A ticket sold by one airline may be flown by a regional subsidiary or codeshare partner. The operating carrier normally appears beside wording such as “operated by” during booking.
- Search the operating carrier in the official IOSA Registry.
- Check whether recent serious events have final investigation reports.
- Distinguish a marketing airline from the company operating the flight.
- Look for several years of performance rather than one unusual year.
- Avoid relying on an unexplained private score as your only source.
Use Fleet Age as Context, Not a Pass-or-Fail Test
An airline’s average fleet age can tell you whether it operates mostly newer or older aircraft, but there is no universal rule that an aircraft becomes unsafe at 15 years. Commercial aircraft are maintained according to flight hours, cycles, calendar limits, structural programs, component requirements, and regulator-approved maintenance schedules.
Pro Tip: Give more weight to transparent oversight, current audit status, investigation findings, and maintenance compliance than to fleet age alone.
Check EU Restrictions and FAA Oversight Results
The EU Air Safety List identifies airlines that are banned or restricted from operating in the European Union because they do not meet applicable international safety standards. The list is updated regularly, so always use the current version.
The FAA International Aviation Safety Assessment program works differently. It evaluates whether another country’s civil aviation authority complies with ICAO safety-oversight standards. Category 1 means the country’s oversight complies with those standards. Category 2 means it does not. This is a country-level oversight assessment, not a consumer airline star rating.
What Will Improve Airline Safety Next?

Future improvements will likely come from better use of flight data, aircraft health monitoring, satellite tracking, conflict-zone intelligence, runway-safety technology, collision-avoidance systems, and stronger sharing of safety information among airlines, airports, manufacturers, and regulators.
Technology alone is not enough. Airlines still need qualified personnel, clear procedures, effective training, independent oversight, well-maintained airport infrastructure, and a safety culture in which employees can report hazards without pressure to hide them.
Major investigations also continue to shape new protections. Lessons from loss-of-control accidents have influenced pilot training, conflict-zone attacks have changed route-risk assessments, and the 2025 Washington collision has produced recommendations concerning helicopter routes, air traffic control, data sharing, and collision-warning technology.
Frequently Asked Questions
Which airline has the worst accident record?
No official worldwide source names one airline as having the worst record under a standardized method. The answer changes with the date range, definition of an accident, number of flights, treatment of subsidiaries, and whether security or military events are included.
What airline brand has had the most crashes?
A brand-based ranking is unreliable because the airline selling the ticket may not operate the aircraft. Regional airlines, subsidiaries, mergers, and codeshare partners can be grouped differently by each database.
Which airlines have had a lot of crashes historically?
Several long-established airlines appear in historical accident databases, including Air India, American Airlines, China Airlines, Korean Air, and Pakistan International Airlines. Their raw totals should not be compared without using the same period, event definition, operator rules, and flight exposure.
Is flying safer now than 20 years ago?
Yes. Long-term commercial-aviation accident and fatal-accident rates have declined substantially, although individual years can rise or fall because accidents are rare and one catastrophic event can heavily affect annual statistics.
Are older aircraft less safe?
Not automatically. Aircraft can remain safe for many years when operators follow approved inspections, structural programs, component-life limits, repairs, maintenance schedules, and airworthiness directives. Fleet age should not replace a review of maintenance and oversight.
How can I check an airline’s safety before booking?
Identify the operating carrier, check the IOSA Registry, review the latest EU Air Safety List, examine the relevant country’s FAA IASA status when applicable, and read official investigation reports for recent serious events.
Conclusion
No trustworthy comparison can identify the airline with the most accidents by using an unexplained raw total. A fair review needs a consistent reporting period, clear accident criteria, the actual operating carrier, and the number of flights operated. Current audit status, government oversight, recent investigation findings, and exposure-adjusted rates provide a more useful picture of airline safety than historical crash counts alone.
Sources
- IATA 2025 Annual Safety Report — global accident rates, fatal accidents, fatalities, and IOSA performance.
- ICAO 2026 Global Safety Analysis — 2025 scheduled-commercial accident data and high-risk occurrence categories.
- IATA Operational Safety Audit — official explanation of IOSA and its audit purpose.
- FAA International Aviation Safety Assessment Program — country-level aviation oversight assessments.
- European Commission EU Air Safety List — current airline operating bans and restrictions.
- Boeing Commercial Jet Accident Statistical Summary — long-term commercial-aviation accident trends.
