

Last Updated on August 25, 2026 by Ethan Caldwell
A single drop of water falling into Lake Itasca in northern Minnesota takes approximately 90 days (three months) to complete its 2,350-mile journey down the Mississippi River to the Gulf of Mexico. Traveling through ten U.S. states and navigating past 29 locks and dams, that water parcel moves at an average overall velocity of roughly 1.09 miles per hour (about 26 miles per day). However, that pace changes constantly as the river broadens, deepens, and absorbs major tributaries on its path to the sea.
Quick Answer
A drop of water takes an average of 90 days to travel the entire 2,350-mile length of the Mississippi River from Lake Itasca to the Gulf of Mexico. The river’s surface speed averages roughly 1.09 mph (26 miles per day), shifting from about 1.2 mph near the Minnesota headwaters to over 3 mph in the deep, free-flowing channels below New Orleans.
Key Takeaways
- Total Travel Time: Approximately 90 days under median seasonal flow conditions.
- Total Distance: Roughly 2,350 miles across 10 states from source to sea.
- Speed Variations: Ranges from 1.2 mph at the shallow headwaters to 3+ mph along the lower commercial corridor.
- Engineered Delays: 29 locks and dams in the Upper Mississippi slow water transit through navigation pools.
- Flow Extremes: Heavy spring floods can compress transit time to roughly 12–15 days, while extreme droughts extend travel past 120 days.
Disclosure: As an Amazon Associate I earn from qualifying purchases. Some links on this page are affiliate links, at no extra cost to you.
How Long Does Water Take to Reach the Gulf of Mexico?
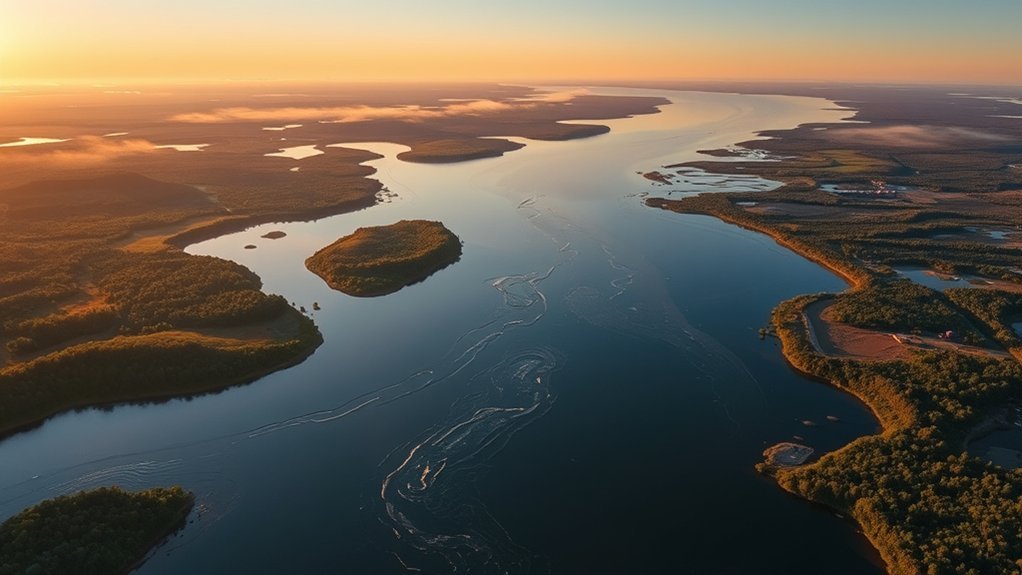
Under normal discharge conditions, the 2,350-mile voyage from Lake Itasca to the Gulf of Mexico takes roughly 90 days. According to the National Park Service, this calculation is based on an average surface velocity of 1.0879 miles per hour, which translates to approximately 26 miles per day.
Because the Mississippi River basin collects runoff from 32 U.S. states and two Canadian provinces, that single drop rarely travels alone or at a steady pace. It encounters changing channel slopes, natural meanders, artificial navigation pools, and massive tributary inputs from the Missouri, Ohio, and Arkansas rivers. By the time that water reaches the river mouth approximately 100 miles downstream from New Orleans, the tiny headwater creek has expanded into an expansive river system discharging over 600,000 cubic feet of freshwater per second into the ocean.
“At an average surface speed of roughly 1.09 mph, a drop of water covers about 26 miles each day, spending three full months traversing the heart of North America.”
What Controls Mississippi River Travel Time?
Water velocity in any open channel is governed by hydraulic gradient (slope), cross-sectional area, channel roughness, and overall discharge volume. On the Mississippi, human engineering works alongside natural geomorphology to either accelerate or delay downstream flow.
Key Factors Influencing Flow Velocity
Water velocity shifts dramatically along the river’s profile due to several primary environmental factors:
- Channel Slope and Gradient: Lake Itasca sits at an elevation of 1,475 feet above sea level. The river drops roughly half that elevation in its first 500 miles, creating distinct high-gradient stretches interspersed with winding, low-gradient floodplains.
- Discharge Volume: As major tributaries join the main stem, the volume of water increases. Increased volume reduces the relative friction against the riverbed, allowing water to flow faster.
- Seasonal Precipitation: High spring runoff and snowmelt elevate water levels and hydraulic pressure, dramatically speeding up travel times compared to late-summer dry periods.
- Bed Roughness and Meanders: Submerged vegetation, sandbars, and sharp meander loops create hydrodynamic drag, slowing down surface and subsurface currents.
Pro Tip: Surface velocity is generally faster than bed velocity. Friction against the river bottom and banks slows down water near the edges, while the fastest current—known as the thalweg—flows near the center just below the surface.
Impact of Locks, Dams, and Levees
Between Minneapolis, Minnesota, and Granite City, Illinois, the river operates as a stepped stairway managed by the U.S. Army Corps of Engineers. A system of 29 locks and dams maintains a nine-foot-deep navigation channel for commercial barge traffic. These dams hold water back into wide, slow-moving navigation pools, substantially extending transit times during low-flow periods.
| Infrastructure Type | Hydraulic Function | Effect on Water Transit Time |
|---|---|---|
| Navigation Dams (Locks 1–29) | Impound water into slackwater pools | Significantly increases transit time during normal and low flow |
| Flood Control Levees | Constrain channel width and prevent floodplain storage | Accelerates flow velocity by concentrating hydraulic energy |
| Wing Dikes & Revetments | Direct flow toward the central navigation channel | Increases central current velocity and scours sediment |
Channel Geometry and Floodplain Alterations
Channel shape determines how energy dissipates across the water column. In narrow, engineered stretches confined by artificial levees, water cannot spread out across natural floodplains. This artificial funneling increases stage height and propels current downstream faster. Conversely, when the river passes through wider natural meanders and oxbows, lateral eddies form, trapping water parcels in slow circulation zones for days before releasing them back into the primary current.
Mississippi River Velocity and Travel Time by Section
Because the Mississippi spans distinct physiographic regions, water speed changes substantially across its three primary reaches.
| River Reach | Geographic Limits | Average Velocity | Flow Characteristics |
|---|---|---|---|
| Headwaters | Lake Itasca to St. Anthony Falls, MN | ~1.2 mph | Shallow, winding, natural lake-and-marsh terrain |
| Upper Mississippi | Minneapolis, MN to Cairo, IL | ~1.5 – 2.0 mph | Controlled by 29 lock-and-dam pools |
| Lower Mississippi | Cairo, IL to Gulf of Mexico | ~3.0 – 3.5 mph | Unobstructed, deep, high-volume flow (up to 5+ mph in flood) |
While the overall average transit time is 90 days, extreme hydrological events swing this figure widely. During major spring flood crests monitored by the National Oceanic and Atmospheric Administration (NOAA), surface velocities can exceed 5 to 6 mph in the lower basin, compressing total transit down to roughly 12 to 15 days. Conversely, during historic summer droughts, low water levels and lock storage can stretch downstream transit beyond 120 days.
Where Does the Mississippi River Begin?
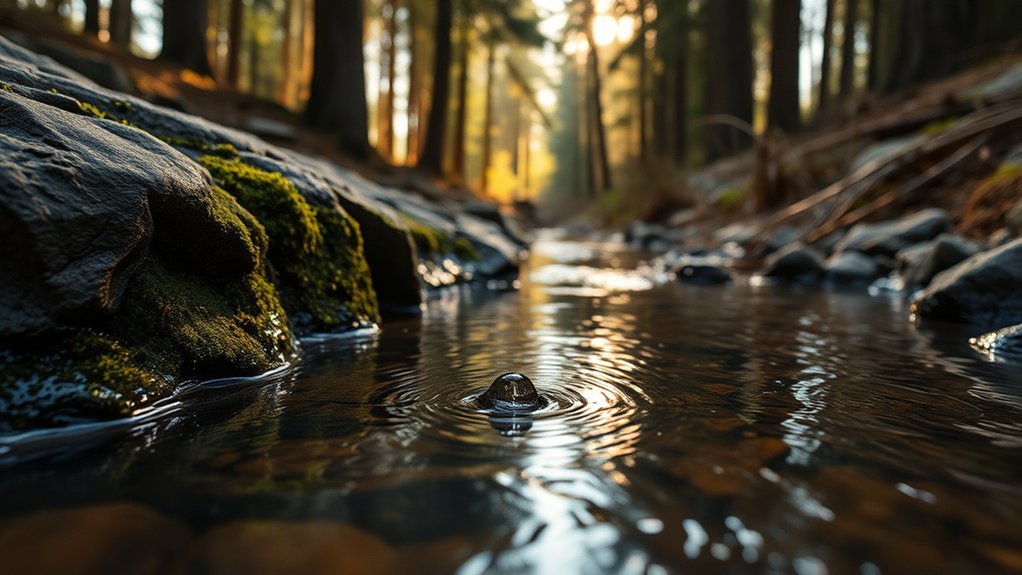
The Mississippi River officially begins at Lake Itasca, located in Clearwater County, Minnesota. Situated inside Itasca State Park, this glacial lake spans approximately 1.8 square miles with an average depth of 20 to 35 feet.
At the lake’s northern outlet, the mighty river starts as a modest, knee-deep stream roughly 20 to 30 feet wide. Visitors can easily wade across the rock dam that marks the headwaters. From this serene starting point 1,475 feet above the sea, the river flows north through several lakes before turning eastward and eventually southward toward the Gulf of Mexico.
Where Does the Mississippi River End?
The Mississippi River empties into the Gulf of Mexico through a massive estuarine-deltaic system located roughly 100 miles downriver from New Orleans, Louisiana. Rather than ending at a single distinct boundary, the river splits into multiple distributaries in an area known as the Bird’s Foot Delta (including Southwest Pass, South Pass, and Pass a Loutre).
At this terminal mixing zone, freshwater combines with saltwater, depositing millions of tons of sediment annually. This dynamic interface sustains productive coastal fisheries, vital navigation passages for international shipping, and extensive coastal wetlands managed by state and federal wildlife agencies.
How Water Dynamics Dictate River Travel
Tracking the transport time of water molecules is central to understanding sediment transport, contaminant dispersal, and ecological nutrient loading across the entire Mississippi watershed. River flow rates recorded by the U.S. Geological Survey (USGS) stream gaging stations demonstrate that travel time is a function of continuous mass balance.
When heavy rainfall swells major tributaries like the Ohio River—which contributes nearly half of the Lower Mississippi’s total discharge—the added mass pushes the downstream water column forward under immense pressure. Understanding these travel mechanics allows hydrologists to accurately forecast flood crest arrivals weeks in advance, protecting river communities and shipping channels.
Note: Dissolved nutrients, such as agricultural nitrates from the Midwest, take the same 90-day journey downriver, ultimately fueling the seasonal hypoxic “dead zone” in the Gulf of Mexico each summer.
How Does the Mississippi Compare to Other Major World Rivers?
The Mississippi’s 90-day transport window is relatively brisk compared to other global river basins where agricultural diversions, arid climates, and vast impoundments drastically prolong residence times.
Global River Transit Times Compared
- Amazon River (~90 Days): Despite measuring over 4,000 miles in length, the Amazon moves a water parcel to the Atlantic in roughly the same 90-day window as the Mississippi. Its immense discharge volume—the largest on Earth—creates powerful, swift currents averaging 1.5 to 3.0 mph.
- Yangtze River (~3 to 6 Months): Spanning 3,917 miles, water transport along China’s Yangtze is heavily moderated by major engineering projects, most notably the massive Three Gorges Reservoir.
- Rio Grande & Colorado River (Months to Decades): In heavily diverted arid basins, natural water rarely completes an uninterrupted downstream run. Massive agricultural irrigation canals, municipal withdrawals, and large storage reservoirs (such as Lake Mead and Lake Powell) hold water for years or consume it entirely before it reaches the sea.
- Thames River (Days to Weeks): Covering just 215 miles, England’s River Thames moves water through 45 lock and weir systems, yielding transit times from a few days during winter runoff to several weeks during dry summer flows.
Frequently Asked Questions
How long would it take a drop of water to travel the Mississippi River?
It takes an average of 90 days (three months) for a drop of water to travel the full 2,350-mile length from Lake Itasca, Minnesota, to the Gulf of Mexico at an average velocity of roughly 1.09 mph (26 miles per day).
How fast does the water flow in the Mississippi River?
Water speed varies along the river. At the Lake Itasca headwaters, it flows at about 1.2 mph. Through the lock-and-dam system of the Upper Mississippi, speeds average 1.5 to 2 mph. In the deep, free-flowing Lower Mississippi below Cairo, Illinois, velocity increases to 3 to 3.5 mph, exceeding 5 mph during high-water flood stages.
How long can a drop of water spend in the ocean?
Once river water reaches the ocean, its average residence time is between 1,000 and 10,000 years before being recycled back into the atmosphere through evaporation, driven by global deep-ocean thermohaline circulation.
How long does it take for a drop of water to complete the entire global water cycle?
There is no single fixed duration. Atmospheric moisture recycles every 9 to 10 days, river water cycles in weeks to months, while water trapped in deep groundwater aquifers or polar ice sheets can remain stored for tens of thousands of years.
How long does it take for a drop of water to travel around the world?
Atmospheric water vapor carried by global jet streams can circumnavigate the globe in a matter of weeks, whereas oceanic water traveling the global conveyor belt takes roughly 1,000 years to complete a full circulation loop.
Conclusion
Tracing a single drop of water from the headwaters at Lake Itasca to the Gulf of Mexico reveals a dynamic, 2,350-mile journey shaped by natural hydrology and extensive human engineering. While the baseline travel time averages 90 days at roughly 1.09 mph, that parcel speeds up through confined levee systems and slows down inside navigation pools. Understanding these velocity shifts demonstrates that river travel time is not a fixed measurement of distance, but a continuously shifting balance of slope, seasonal discharge, and river control.
Sources
- National Park Service (NPS) — Mississippi River facts, total mileage, and average flow velocity metrics.
- U.S. Geological Survey (USGS) — Real-time streamflow, discharge, and hydrologic data across the Upper Midwest.
- U.S. Army Corps of Engineers (USACE) — Mississippi River navigation infrastructure and lock-and-dam system operations.
- NOAA National Weather Service — Lower Mississippi River Forecast Center stage height and crest tracking.

